Simulation
Enzymatic device
Many components in the Enzymatic device may result in combinatorially large number of intermediate structures. To predict the behavior of the device, we formalized a model with ordinary differential equation (ODE) based on chemical kinetics of the process. The numerical simulation was carried by software (Scilab), while the ODEs were derived by writing down all the possible intermediate reaction by hand (more than 400 equations). Please take a look at Source_code, All_intermediates.
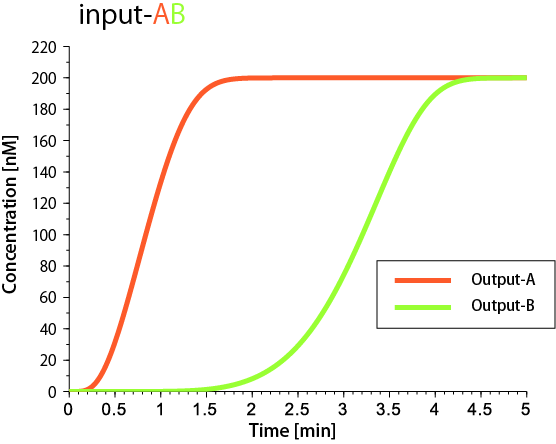
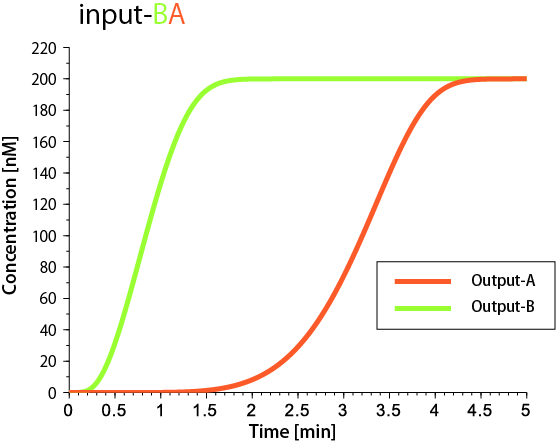
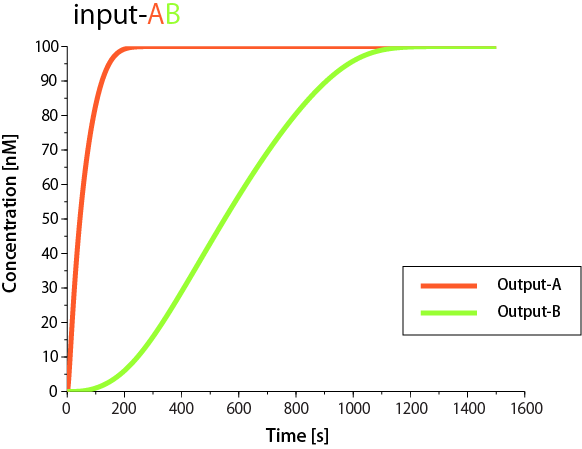
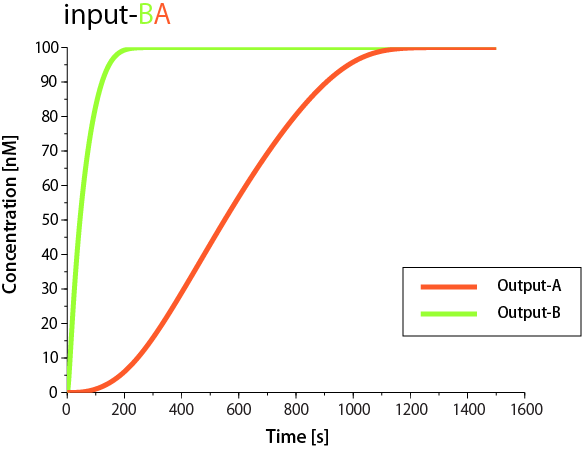
We have conducted two simulations with Input A then B (Fig.1 left) and B then A (Fig.1 right). These results indicate that the order of Output is programmable.
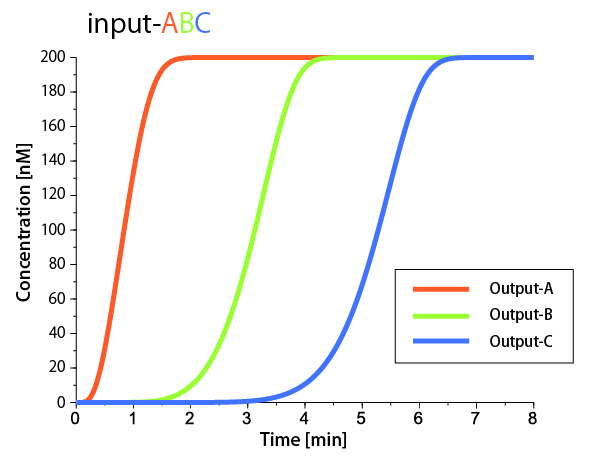
Next, we increased the number of Instruction from two to three. The result is shown in Fig.2. Three Outputs were properly released in order (A then B then C). Even the model contains more than 400 intermediates, our elaborate design makes the device possible to behave as programmed.
Moreover, time intervals between releases can be controlled by tuning the concentration of Input. We define the output-time as the time when 50% of the Output is released. We measured time between consecutive output-time. Fig.3 shows the relationship between Input concentration and the time intervals.
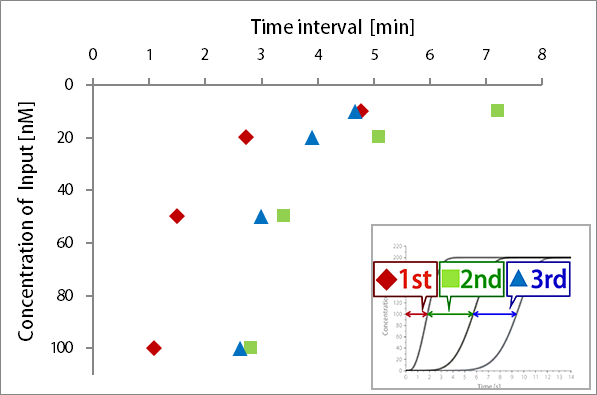
Fig.3 Relationship between Input concentration and time interval. Time intervals were evaluated for various Input concentrations (10nM ,20nM, 50nM, and 100nM).
Time intervals (between 1st and 2nd release, between 2nd and 3rd release) can be independently controlled by changing concentration of Templates or Gates. For example, Fig.4 shows relationship between Template-B concentration and the time interval.
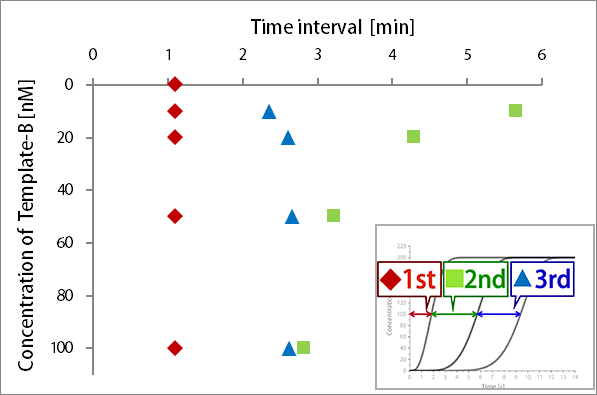
Fig.4 Relationship between Template-B concentration and time interval. (Template-B concentration; 10nM, 20nM, 50nM and 100nM).
More data about controlling time intervals are available here (Template-A, Template-C, All Gates, Gate-A, Gate-B ). All time interval were obtained from graphs available here.
From the simulation results, we confirmed the following functionalities and features of Enzymatic device.
- Programmability of permutation of Outputs
- Scalability of the number of Outputs
- Controllability of the time intervals between Outputs releases
Enzyme-free device
As
well as Enzymatic device, we formalized ODEs for the Enzyme-free device based on chemical kinetics. The numerical simulation was carried out by mathematical (Scilab). The ODEs were derived by writing down all the possible intermediates by hands.
Source codes, workflows of chemical reactions and more information are available
here ( Source_code_1,
Source_code_2,
All_intermediates).
By simulation, we have analyzed the performance of the Enzyme-free device.
At first, we simulated the model of 2-instruction operation. The results are shown in Fig.5.
Then, we simulated 3-instruction operation (Fig.6). The device releases three Outputs in proper order (A then B then C). This result proves that the number of Outputs is scalable.
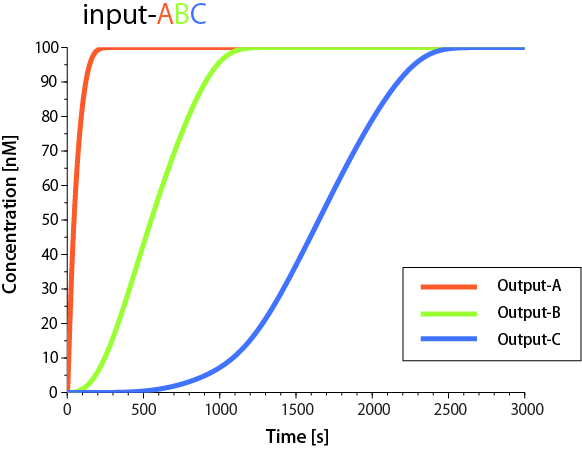
Fig.6 Simulation of 3-instruction operation. Initial concentrations of all the Inputs, Templates, Transducer, Gates, and Fuel are 200, 200, 100, 200, 400nM, respectively. [source_code_2]
Next, we analyzed the time intervals between releases. The time intervals can be controlled by changing concentration of some relevant component. Fig.7 shows the time intervals with various Input concentrations. The interval between 1st and 2nd ranges from 4min to 8min, while the time interval between 2nd and 3rd ranges from 12min to 18min by Input. In addition, the interval between 2nd and 3rd can be controlled by adjusting Gate-B concentration (Fig.8). More data about the time interval control by other components are available here (Changing Gate-A, All_Gates, all Fuels, Fuel-A, Fuel-B, Trigger). All time interval were obtained from graphs available here.
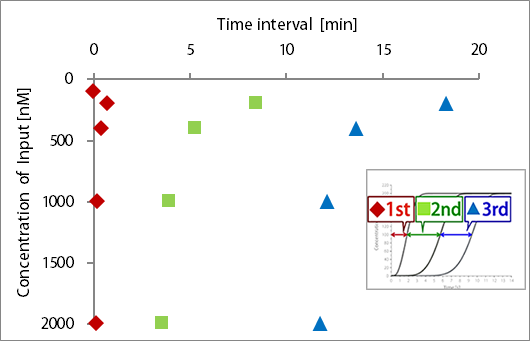
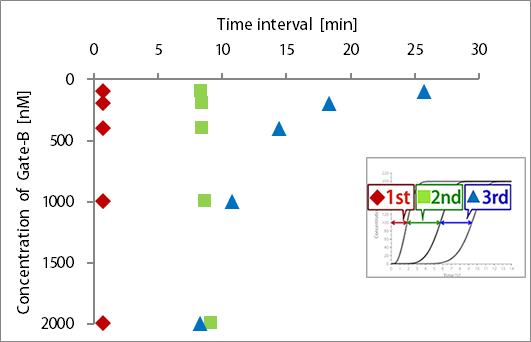
| Fig.7 Time intervals controlled by Input concentrations | Fig.8 Time intervals controlled by Gate-B concentrations |