Materials and Methods
Simulation Condition
Enzymatic Device
Values of chemical parameters are as follows.| Hybridization: | kh1=3.0×10⁸[M-1min-1] |
| kh2=3.0×10⁷[M-1min-1] | |
| Denaturation: | kd=1.0×10⁵[min-1] |
| Branch migration: | kb=1.0×10⁵[min-1] |
| Polymerase: | kp=17[min-1] |
| Nickase: | kn=3.0[min-1] |
| Restriction enzyme: | kr=3.0[min-1] |
These parameter are referenced from [1,2].
Enzyme Free Device (Simulation)
Values of chemical parameters are as follows.| Seesawing reactions : | ks=5.0×10⁴ [M-1s-1] |
| Toehold binding reactions : | kf=2.0×10⁶ [M-1s-1] |
| Toehold binding reactions : | krf=10 [s-1] |
These parameter are referenced from [3].
Enzymatic Device
Sample Preparation
DNA sequences
We designed DNA sequences by Sequence Design. That is a software developed in our labratory, which is a partial implementation of [4,5].
All DNAs for the experiments purchased from Eurofins are shown in Fig.1.
02.png)
Fig.1 DNAs for experiments
| Input-AB | 5'-CTAGAACATACGCATTTGATTCGCGAATTCAGCAGTACTATTCAAGCGACGGCT-3' |
| Input-BA | 5'-AGCAGTACTATTCAAGCGACGGCTGAATTCCTAGAACATACGCATTTGATTCGC-3' |
| Input-ABC | 5'-GCCTGATAGACCGTTTCCGTAGTAGAATTCCTAGAACATACGCATTTGATTCGCGAATTCAGCAGTACTATTCAAGCGACGGCT-3' | Input-CAB | 5'-CTAGAACATACGCATTTGATTCGCGAATTCAGCAGTACTATTCAAGCGACGGCTGAATTCGCCTGATAGACCGTTTCCGTAGTA-3' |
| Template-A | 5'-TCACTTCTGCATCGATCACGACTCAGCCGTCGCTTGAATAGTGTTA-3' |
| Template-B | 5'-AGGATATGCTCTCGTTCACGACTCGCGAATCAAATGCGTATGGTTA-3' |
| Template-C | 5'-AATCTACTCGCTACATCACGACTCTACTACGGAAACGGTCTAGTTA-3' |
| Output-A | 5'-TAGGTACGCTCCGACAAGGT-3' |
| Output-B | 5'-GTACAGGCATCTATACGTTACCATA-3' |
| Output-C | 5'-AGCTTATGTTGCATATCTTAGTGTCCATCGCGTAG-3' |
| Transducer-A | 5'-ACCTTGTCGGAGCGTACCTATCACTTCTGCATCGA-3' |
| Transducer-B | 5'-TATGGTAACGTATAGATGCCTGTACAGGATATGCTCTCGT-3' |
| Transducer-C | 5'-CTACGCGATGGACACTAAGATATGCAACATAAGCTAATCTACTCGCTACA-3' |
| Gate-A + | 5'-AGCGTCATCGGTCTTTAAGCAGTACTATTCAAGCGACGGCTTCACTTCTGC-3' |
| Gate-A - | 5'-TCACGACTCAGCCGTCGCTTGAATAGTACTGCTGAATTCCCGATGACGCT-3' |
| Gate-B + | 5'-TGCTTAGAACGAGGCTTCTAGAACATACGCATTTGATTCGCAGGATATGCT-3' |
| Gate-B - | 5'-TCACGACTCGCGAATCAAATGCGTATGTTCTAGGAATTCCGTTCTAAGCA-3' |
| Gate-C + | 5'-GCCAGATTCCACATCCGGCCTGATAGACCGTTTCCGTAGTAAATCTACTCG-3' |
| Gate-C - | 5'-TCACGACTCTACTACGGAAACGGTCTATCAGGCGAATTCTGGAATCTGGC-3' |
| Signal-A | 5'-TCGATGCAGAAGTGA-3' |
| Signal-B | 5'-ACGAGAGCATATCCT-3' |
| Siganl-C | 5'-TGTAGCGAGTAGATT-3' |
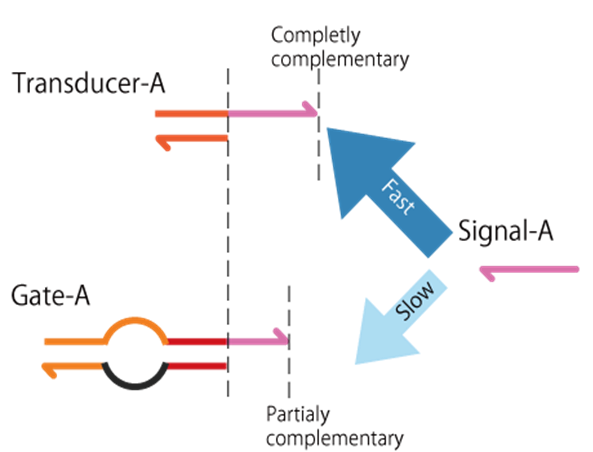
Signal hybridizes to Transducer faster than to Gate. That is because Transducer has a longer toe-hold to Signal than Gate. By this design, Updating process does not occur until most of Output is released from Transducer.
Enzymes
Both Polymerase (Bst DNA Polymerase, Large Fragment) and Nickase (Nt.BstNBI) were purchased from NEW ENGLAND BioLabs JAPAN. EcoRI (TAKARA BIO INC.) was used as restriction enzyme. The recognition sites for nickase and EcoRI are shown in Fig.3.
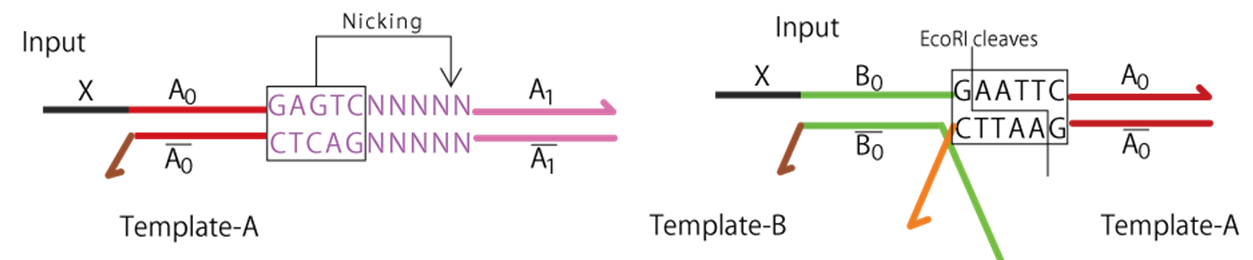
Fig.3 Recognition sites for nickase (left) and EcoRI (right)
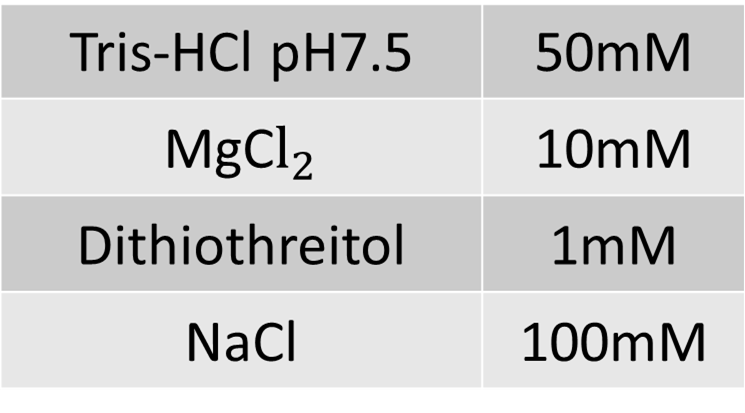
H Buffer
The composition of 1 × H Buffer is as follows.
Functionality
2-instruction operation
-
Input-AB or BA/Template complex, Transducer, and Gate were formed by annealing (cooling from 95 to 20°C for 75min, -1°C/min). All samples were mixed after the formation of complexes (final concemtration of each components were 200nM).
-
Enzymatic reaction was conducted for various time (0, 1/6, 1/2, 1, 2, 5, 10, 12, 15, 20, 25, 30, 40 min), then these were left at 80°C for 30 minutes. After that, all the samples were annealed again for 35 minutes (cooling from 95 to 70°C for 25min, -1°C/min, then cooling from 70 to 20°C for 10min, -5°C/min).
-
15% acrylamide gel was formed with 1×TBE buffer.
-
The electrophoresis was conducted at 100V for 85 min.
-
Imaging by gel imager with Green light.
3-instruction operation
-
Input-ABC or CAB/Template complex, Transducer and Gate were formed by annealing (cooling from 95 to 20°C for 75min, -1°C/min). All samples were mixed after the formation of these complexes (final concemtration of each components were 200nM).
-
Enzymatic reaction was conducted for various time (0, 1/6, 1/2, 1, 2, 5, 10, 12, 15, 20, 22, 25, 30, 35, 40, 45, 50, 60 min), then these were left at 80°C for 30 minutes. After that, all samples were annealed again for 35 minutes (cooling from 95 to 70°C for 25min, -1°C/min, then cooling from 70 to 20°C for 10min, -5°C/min).
-
15% acrylamide gel was formed with 1×TBE buffer.
-
The electrophoresis was conducted at 100V for 85 min.
-
Imaging by gel imager with Green light.
Testing elementary processes
Reading process
-
Input and Template was annaled to form the complex.
(Cooling from 95 to 20°C (-1°C/min)).
-
Enzymatic reaction was conducted at 37°C/55°C for 1 hour in thermal cycler.
-
Formation of 20% acrylamide gel
-
Gel-electrophoresis was conducted at 100V for 50 minutes. Then gel was stained by SYBR Gold.
-
Imaging by gel imager (BioRad)
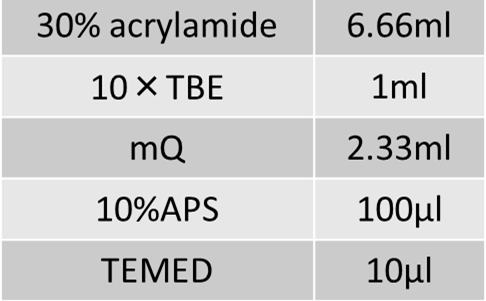
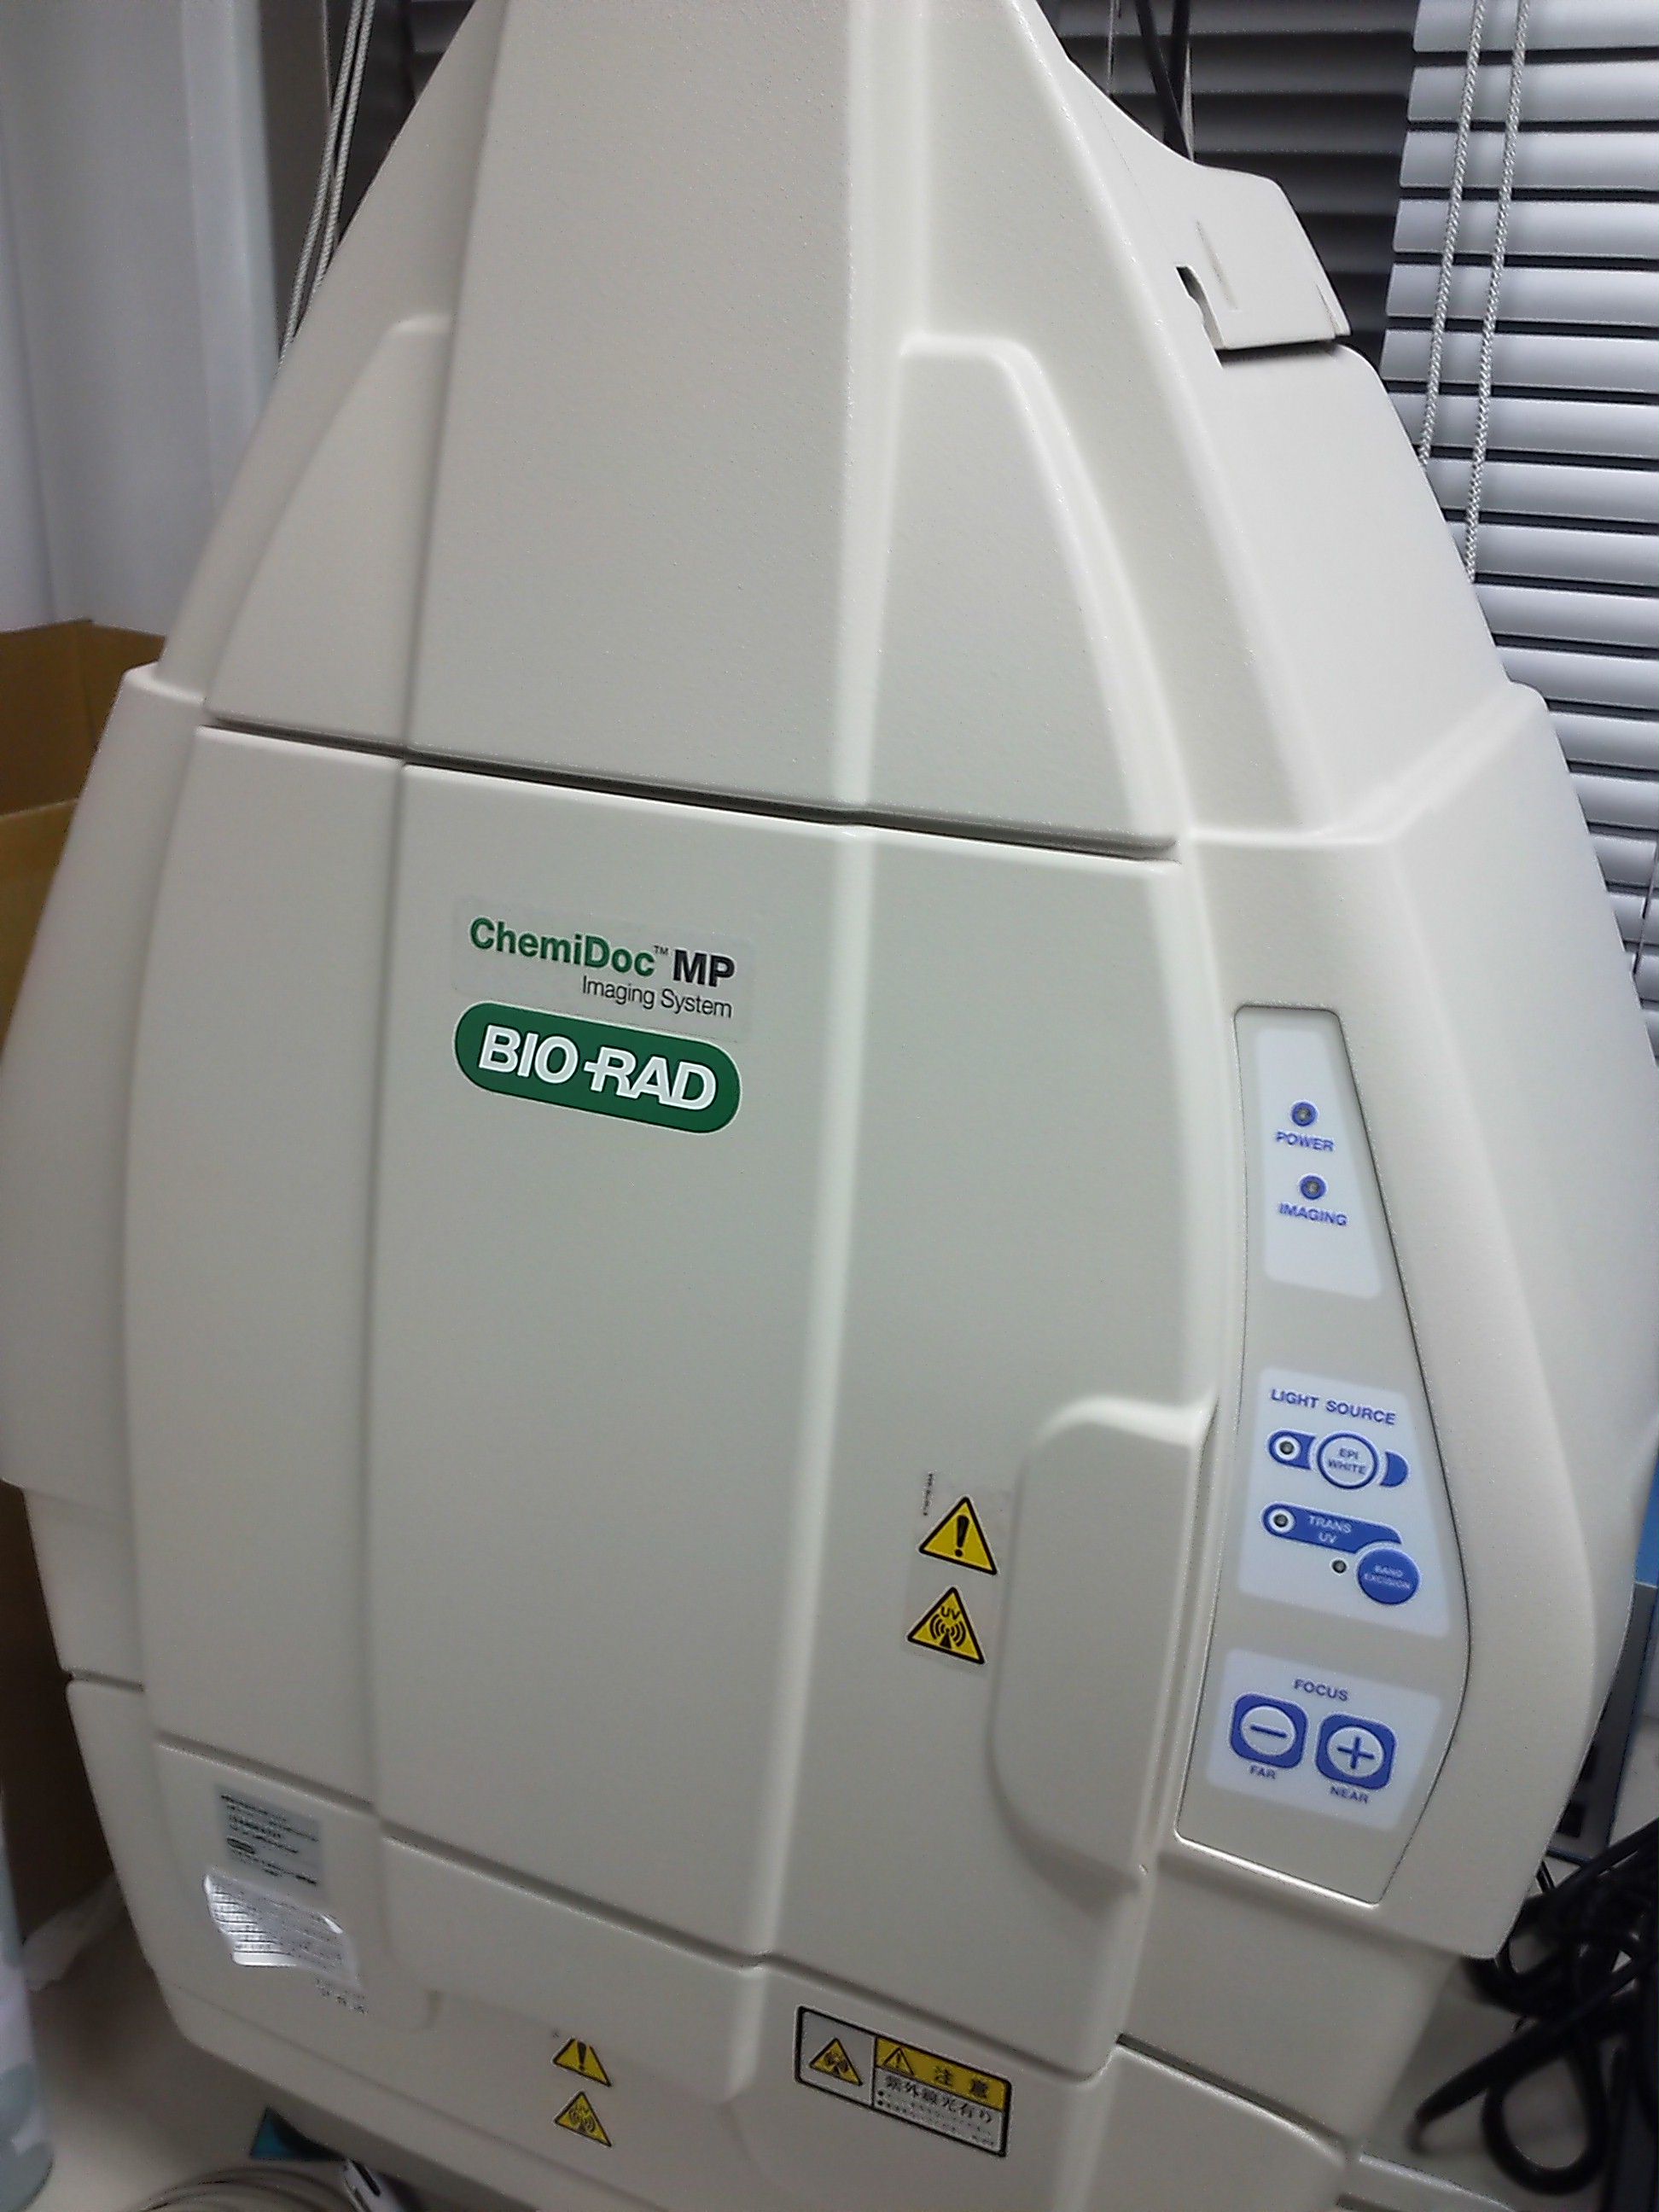
Fig.4 Gel imager (BioRad)
Releasing process
-
Transducer and Signal were mixed and then annealed from 95 to 20°C (-1°C/min).
-
Enzymatic reaction was conducted at 37°C/55°C for 1 hour in thermal cycler.
-
Gel-electrophoresis was conducted at 100V for 100 minutes with 20% acrylamide gel. Then gel was stained by SYBR Gold. Then gel was stained by SYBR Gold.
-
Imaging by gel imager (BioRad).
Updating process
-
Input-Template complex and Gate were formed by annealing (95 to 20°C, -1°C/min).
-
Enzymatic reaction was conducted at 45°C for 3 hour in thermal cycler.
-
Gel-electrophoresis was conducted at 100V for 75 minutes with 15% acrylamide gel. Then gel was stained by SYBR Gold.
-
Imaging by gel imager (BioRad).
Reaction speed measurement
-
Input/Template complex and Output complex were formed by annealing (cooling from 95 to 20°C for 75min, -1°C/min). All samples were mixed after the formation of complexes.
-
Enzymatic reaction was conducted for various time (1,2,5,10,20,50 min), then were kept at 80°C for 20min. After that, all the samples were left at room temperature until the time of applying (more than 1 hour).
-
15% acrylamide gel was formed with 1×TBE buffer.
-
The electrophoresis was conducted at 100V for 75 min.
-
Imaging by gel imager with Blue LED (Non-stained gel image).
-
Gel was stained by SYBR Gold then imaged with UV light (Stained gel image).
Enzyme-free device
Preparation of DNA sequences
We designed DNA sequences by Sequence Design. All DNA shown below were purchased from Eurofins.
| Input-A + | 5'-CAGATGACTTTACGAGATACGATATTCCTTCTGCC-3' |
| Input-A - | 5'-GTATCTCGTAAAGTCATCTGCATAG-3' |
| Input-B - | 5'-CAGATGACTTTACGATCAAGGATATTCCTTCTGCC-3' |
| Input-AB + | 5'-CTTGATCGTAAAGTCATCTGGTATCTCGTAAAGTCATCTGCATAG-3' |
| Input-BA + | 5'-GTATCTCGTAAAGTCATCTGCTTGATCGTAAAGTCATCTGCATAG-3' |
| Trigger | 5'-CTATGCAGATGACTTTACGA-3' |
| Output-A | 5'-[FAM]-CAGATGACTTTACG-3' |
| Transducer-A - | 5'-CGTATCTCGTAAAGTCATCTG-[BHQ1]-3' |
| Output-B | 5'-CAGATGACTTTACG-3' |
| Transducer-B - | 5'-CCTTGATCGTAAAGTCATCTG-3' |
| Gate-A + | 5'-GATATTCCTTCTGCCGATACCAGATGACTTTACGA-3' |
| Gate-A - | 5'-GTATCGGCAGAAGGAATATCGTATC-3' |
| Gate-B + | 5'-GATATTCCTTCTGCCTCAAGCAGATGACTTTACGA-3' |
| Gate-B - | 5'-CTTGAGGCAGAAGGAATATCCTTGA-3' |
| Fuel-A | 5'-GATATTCCTTCTGCCGATAC-3' |
| Fuel-B | 5'-GATATTCCTTCTGCCTCAAG-3' |
Fig.5 shows the details of catalytic reaction by consuming fuel.
.png)
Fig.5 Details of catalytic reaction by consuming fuel
Functionality
-
Final concentration of each component are
Input, Transducer, and Gate were annealed for 75 minutes in advance (from 95 to 20°C, -1°C/min).Input : 200nM Transducer : 100nM Gate : 200nM Fuel : 400nM
-
Fluorescence intensity was measured by spectrofluorometer (FP6200, JASCO). The wavelength of excitation was 465 nm. The fluorescence intensity at 520 nm was measured.
Testing elementary reactions
Measurement of fluorescence
We apply FRET [6] to detect the release of Output-A. Before the releasing, the 6-FAM does not glow because the fluorescence of 6-FAM is absorbed by BHQ-1. In the presence of Signal, Output-A is released, and then 6-FAM glows. Therefore, we can confirm whether Output is released or not.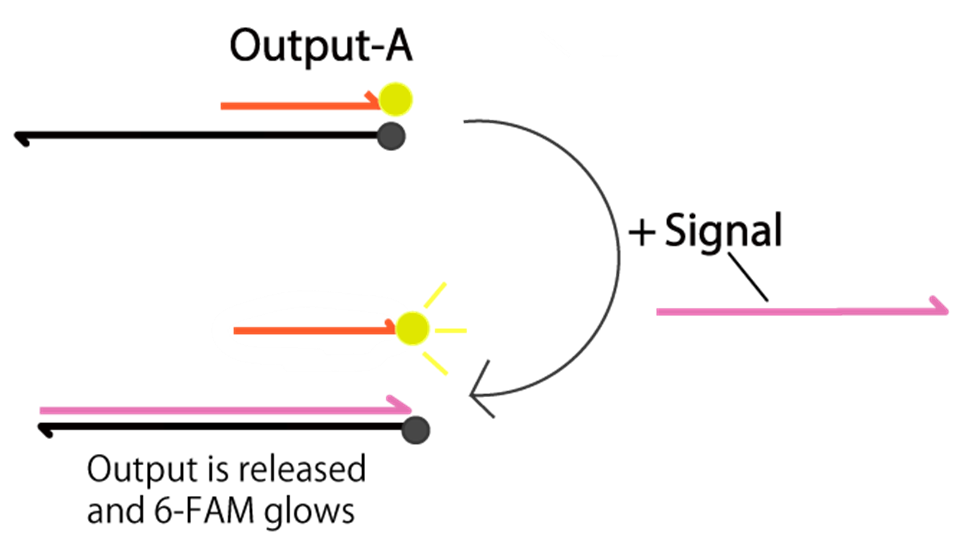
Fig.6 Detection of Output-A by FRET
-
Input was annealed at the consentration of 10µM.
The annealing was conducted for 75 minutes (from 95 to 20°C, -1°C/min).
-
Fluorescence intensity was measured by spectrofluorometer (FP6200, JASCO) for 5000 seconds with 10 second interval.
The wavelength of excitation light was 492 nm. The fluorescence intensity of 515 nm light was measured.
Transducer, Gate, and Trigger were mixtured before the addition of Input.
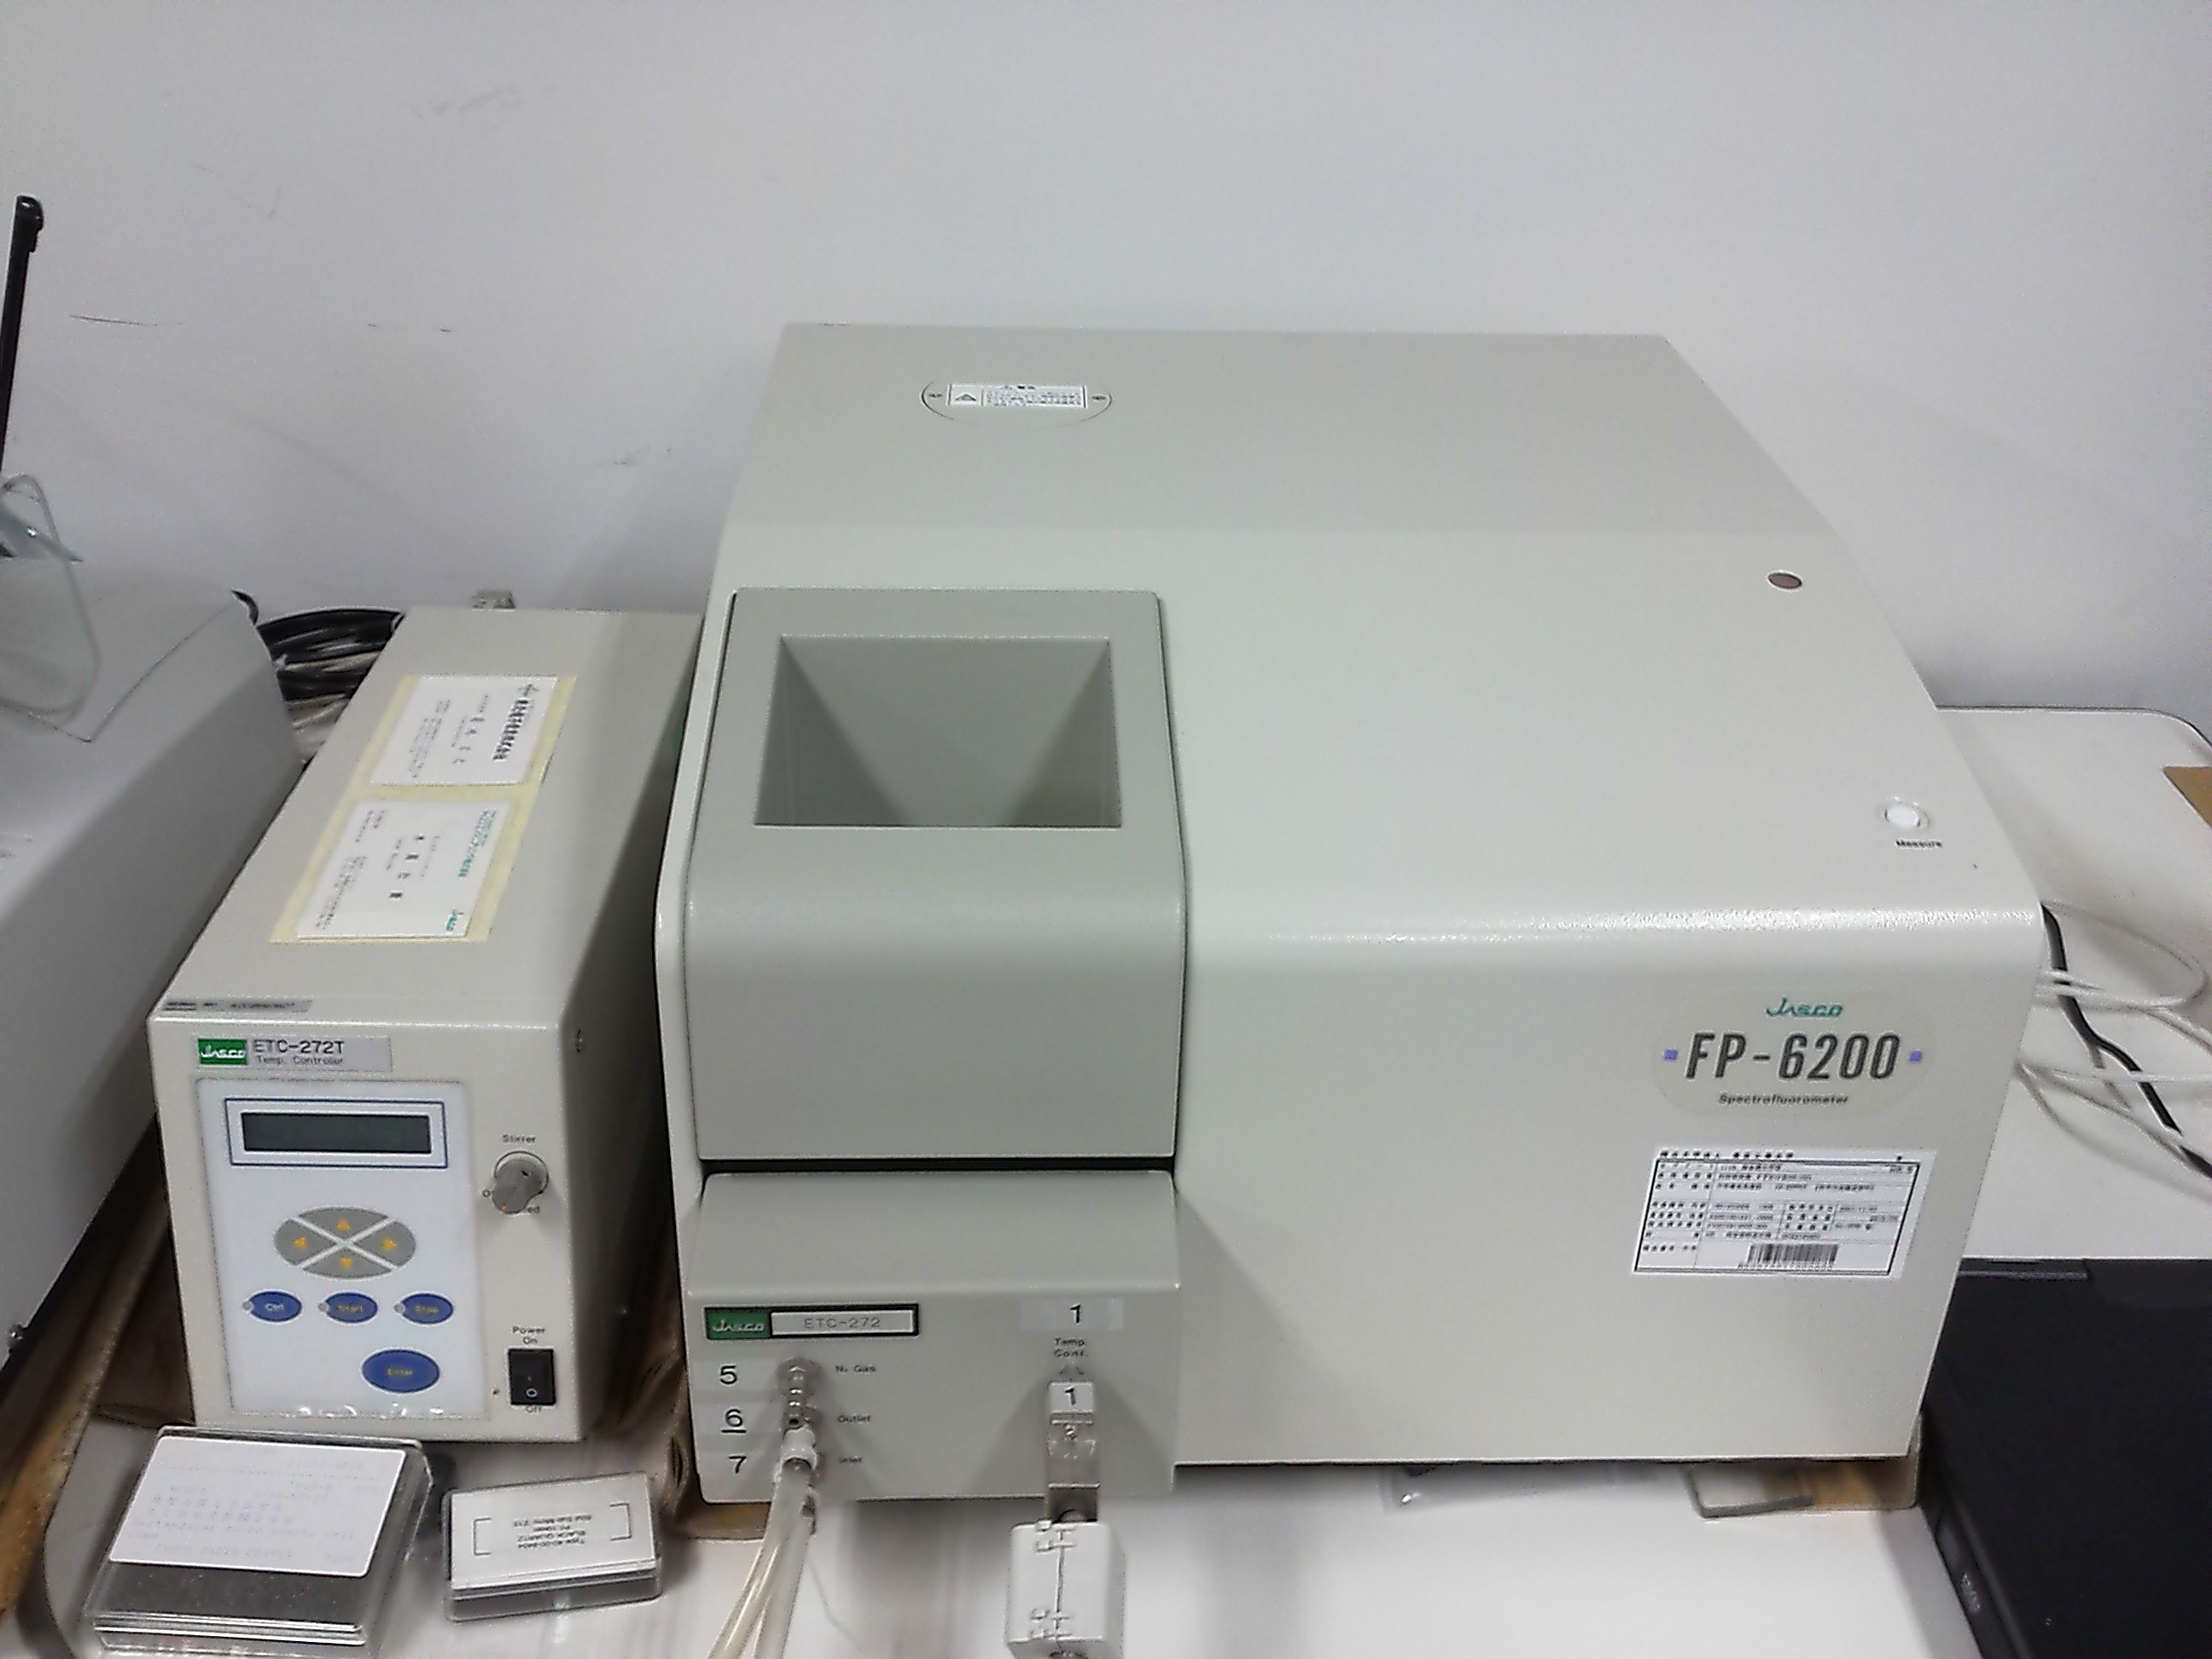
Fig.7 Spectrofluorometer(FP6200, JASCO)
Electrophoresis
-
Input and Output were formed by annealing (cooling from 95 to 20°C for 75min, -1°C/min). All samples were mixed after the formation of complexes.
-
15% acrylamide gel was formed with 1×TAE buffer.
-
The electrophoresis was conducted at 100V for 75 min.
-
Imaging by gel imager with Blue LED (Non-stained gel image).
-
Gel was stained by SYBR Gold then imaged with UV light (Stained gel image).